
Spring Boot Actuator is a Spring module that allows you to monitor a Spring Boot application quickly and easily.
You only need to import the starter dependency of the actuator and you will have immediately available the endpoints that will provide you with
information about app status, environment variables and more.
We will use as an application to monitor that of the tutorial: Spring Boot REST, changing the app name in spring-monitoring-client for convenience.
Prerequisites
- Set up a jdk (we will use the version 8, but you can use successive versions).
- Installing maven (https://maven.apache.org/install.html).
First step: let's import the following Maven dependency
<dependencies>
    <dependency>
        <groupId>org.springframework.boot</groupId>
        <artifactId>spring-boot-starter-actuator</artifactId>
    </dependency>
</dependencies>
Second step: modify the application.properties
server.port=8081
management.endpoints.web.exposure.include=*
management.endpoint.health.show-details=always
spring.jmx.enabled=true
spring.application.name=spring-monitoring-client

info.app.name=@description@
info.app.description=Esempio di Spring Boot Actuator
info.app.version=@version@
info.author.name=Vincenzo
info.author.surname=Racca
info.author.website=https://vincenzoracca.com
Properties with the prefix management are used to set the Spring Actuator monitoring.
In particular with endpoints.web.exposure.include=* we are indicating to actuator that we want to expose all of its endpoints
(by default some are hidden) and with endpoint.health.show-details=always we indicate that in addition to the app status (UP/DOWN),
we also want all other information provided by endpoint health, such as the status of the database.
Properties with the suffix info allow us to customize the actuator info section with any information we want.
Third step: create a data.sql file
We create a file named data.sql inside src/main/resources with the following content:
INSERT INTO user (name, surname, address) VALUES ('Vincenzo', 'Racca', 'via Roma');
INSERT INTO user (name, surname, address) VALUES ('Pippo', 'Pluto', 'via Chiaia');
Fourth step: we start the application
We start the application and invoke the endpoint: localhost:8081/actuator. We will have as answer the endpoints:
{
    "_links": {
        "self": {
            "href": "http://localhost:8081/actuator",
            "templated": false
        },
        "beans": {
            "href": "http://localhost:8081/actuator/beans",
            "templated": false
        },
        "caches-cache": {
            "href": "http://localhost:8081/actuator/caches/{cache}",
            "templated": true
        },
        "caches": {
            "href": "http://localhost:8081/actuator/caches",
            "templated": false
        },
        "health": {
            "href": "http://localhost:8081/actuator/health",
            "templated": false
        }
},
       ...
}
These are all endpoints provided by Actuator. We invoke the health resource: localhost:8081/actuator/health.
{
    "status": "UP",
    "components": {
        "db": {
            "status": "UP",
            "details": {
                "database": "H2",
                "validationQuery": "isValid()"
            }
        },
        "diskSpace": {
            "status": "UP",
            "details": {
                "total": 210974404608,
                "free": 161783414784,
                "threshold": 10485760,
                "exists": true
            }
        },
        "ping": {
            "status": "UP"
        }
    }
}
We will have a JSON with info about the status of the app, db, disk and ping. If we wanted the status of a particular component, like
db, just add the component to the path, such as: /actuator/health/db.
Calling localhost:8081/actuator/info we will have the following answer instead:
{
    "app": {
        "name": "Spring Actuator Application",
        "description": "This is a very simple Spring Boot Application",
        "version": "0.0.1-SNAPSHOT"
    },
    "author": {
        "name": "Vincenzo",
        "surname": "Racca",
        "website": "https://vincenzoracca.com"
    }
}
An interesting API is the one about metrics: invoking localhost:8081/actuator/metrics
we will have as answer the metrics provided by Spring Actuator. To know the value of a metric just
add as path param the name of the metric, as for example/actuator/metrics/system.cpu.usage
and we will have an answer similar to this one:
{
    "name": "system.cpu.usage",
    "description": "The \"recent cpu usage\" for the whole system",
    "baseUnit": null,
    "measurements": [
        {
            "statistic": "VALUE",
            "value": 0.513888888888889
        }
    ],
    "availableTags": []
}
Fifth step: we create a custom health
We can also create various custom healths by implementing the HealtIndicator interface.
@Component
public class UserHealthChecker implements HealthIndicator {

    private final UserRepository userRepository;

    public UserHealthChecker(UserRepository userRepository) {
        this.userRepository = userRepository;
    }

    @Override
    public Health health() {
        Map<String,Long> inits = new HashMap<>();
        long count = userRepository.count();
        if(count > 0) {
            inits.put("userInit",count);
            return Health.up().withDetails(inits).build();
        }
        else {
            return Health.down().withDetail("userInit", "FAILED").
                    build();
        }
    }
}
This simple metric verifies the correct initialization of the user table at app startup. If the number of users is greater than zero, health will have UP status with total users, otherwise the status will be DOWN. Default statuses are:
- UP
- DOWN
- OUT_OF_SERVICE
- UNKNOWN
You can still add custom states.
Fifth step: http call monitoring
To monitor HTTP calls we need to create a bean of type HttpTraceRepository. Spring provides an implementation of this interface with the InMemoryHttpTraceRepository class that allows you to keep in memory the last 100 HTTP calls made.
@Configuration
public class HttpTraceConfig {

    @Bean
    HttpTraceRepository httpTraceRepository() {
        return new InMemoryHttpTraceRepository();
    }
}
Calling the endpoint /actuator/httptrace we should have an answer similar to this one:
    "traces": [
        {
            "timestamp": "2020-10-16T11:13:48.052Z",
            "principal": null,
            "session": null,
            "request": {
                "method": "GET",
                "uri": "http://localhost:8081/users",
                "headers": {
                  ...
                    "user-agent": [
                        "PostmanRuntime/7.26.5"
                    ]
                },
                "remoteAddress": null
            },
            "response": {
                "status": 200,
                "headers": {
                    "Keep-Alive": [
                   ...
            "timeTaken": 57
        }
    ]
}
where timeTaken is the number of milliseconds it took to handle the request.
As we have noticed, Spring Actuator is very easy to integrate into our Spring Boot project and provides interesting endpoints for
monitor the app. We have also explored only some of its features. For example, you can also provide custom endpoints or
change the level of a log at runtime via the endpoint /loggers/{name}.
Another great advantage is that this module from version 2 use Micrometer which is an open source metrics facade that provides a list of vendor-neutral metrics APIs. A bit like when we use JPA bees and then we can use any vendor like Hibernate or EclipseLink. Micrometer is easily integrated with Prometheus which is a widely used open source monitoring system. In turn Prometheus is easily integrated with Grafana, an open source application that allows you to display the metrics of an application through graphs. Basically with Spring Actuator you can open a world of possible integrations!
But what if we want to monitor an application made by microservices? Each microservice would have its own Spring Actuator making a little bit of the monitoring of the entire app is confusing. Or if we wanted to show the metrics provided by Spring Actuator in a cleaner way without needing to install other applications like Prometheus and Grafana? We can use Spring Boot Admin!
Spring Boot Admin is a project born to manage and monitor Spring Boot Applications in a centralized and graphical way.
In particular there will be a Spring Boot Admin Server app that can manage a list of web services (client applications).
Client applications can register to the server application (Spring Boot Admin Server) with Spring Boot Admin Client (a maven dependency).
or if you use a Service Discovery like Eureka just add the Spring Boot Admin Server app as Discovery Client. The Spring Boot frontend
Admin Server is written in vue.js.
Sixth step: we create a Spring Boot Monitoring Server app
This will be our Spring Boot Admin Server, which will be able to manage several web services together (therefore particularly suitable for the microservices). Add these dependencies:
 <dependencies>
    <dependency>
        <groupId>de.codecentric</groupId>
        <artifactId>spring-boot-admin-starter-server</artifactId>
    </dependency>

    <dependency>
        <groupId>org.springframework.boot</groupId>
        <artifactId>spring-boot-starter-mail</artifactId>
    </dependency>
</dependencies>
Add the class:
@SpringBootApplication
@EnableAdminServer
public class SpringMonitoringServerApplication {

	public static void main(String[] args) {
		SpringApplication.run(SpringMonitoringServerApplication.class, args);
	}

}
Finally, we modify the application.properties
spring.mail.host=smtp.gmail.com
spring.mail.port=587
spring.mail.properties.mail.smtp.auth=true
spring.mail.properties.mail.smtp.starttls.enable=true
spring.mail.username=mail
spring.mail.password=password
spring.boot.admin.notify.mail.to=mail
These properties are used to receive email notifications when the status of one of the apps that manages Spring Boot Admin Server changes. Obviously it is not mandatory; in this case we can omit these properties. Moreover Spring Boot Admin supports many other notification systems like Slack, Telegram and Microsoft Teams.
Let's start the application now.
Step 7: associate the Spring Monitoring Client app with the Spring Monitoring Server
We add this dependency in the pom of our client app:
<properties>
    <spring-boot-admin.version>2.3.0</spring-boot-admin.version>
</properties>
<dependency>
    <groupId>de.codecentric</groupId>
    <artifactId>spring-boot-admin-starter-client</artifactId>
</dependency>

<dependencyManagement>
    <dependencies>
        <dependency>
            <groupId>de.codecentric</groupId>
            <artifactId>spring-boot-admin-dependencies</artifactId>
            <version>${spring-boot-admin.version}</version>
            <type>pom</type>
            <scope>import</scope>
        </dependency>
    </dependencies>
</dependencyManagement>
Then add the property in the application.properties:
spring.boot.admin.client.url=http://localhost:8080
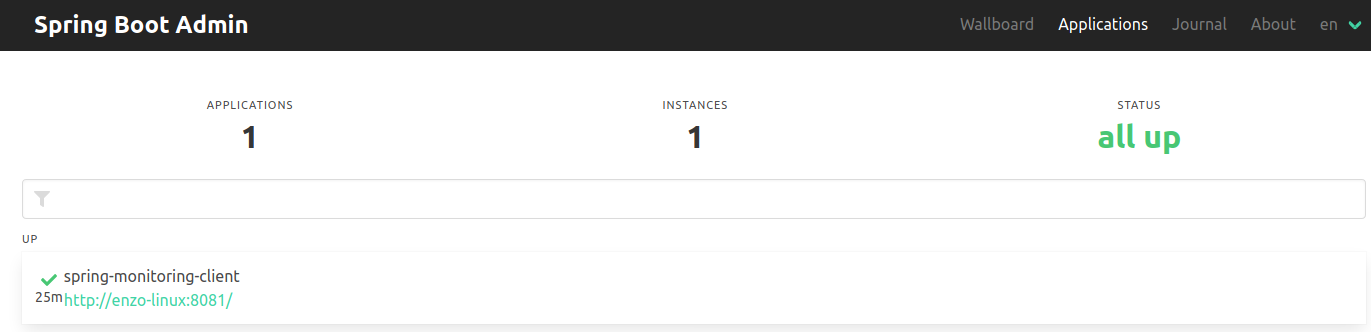
We also start the client app. From browser we go to localhost:8080. We will have a screen similar to this one:
Clicking on the app name will open the monitoring detail:
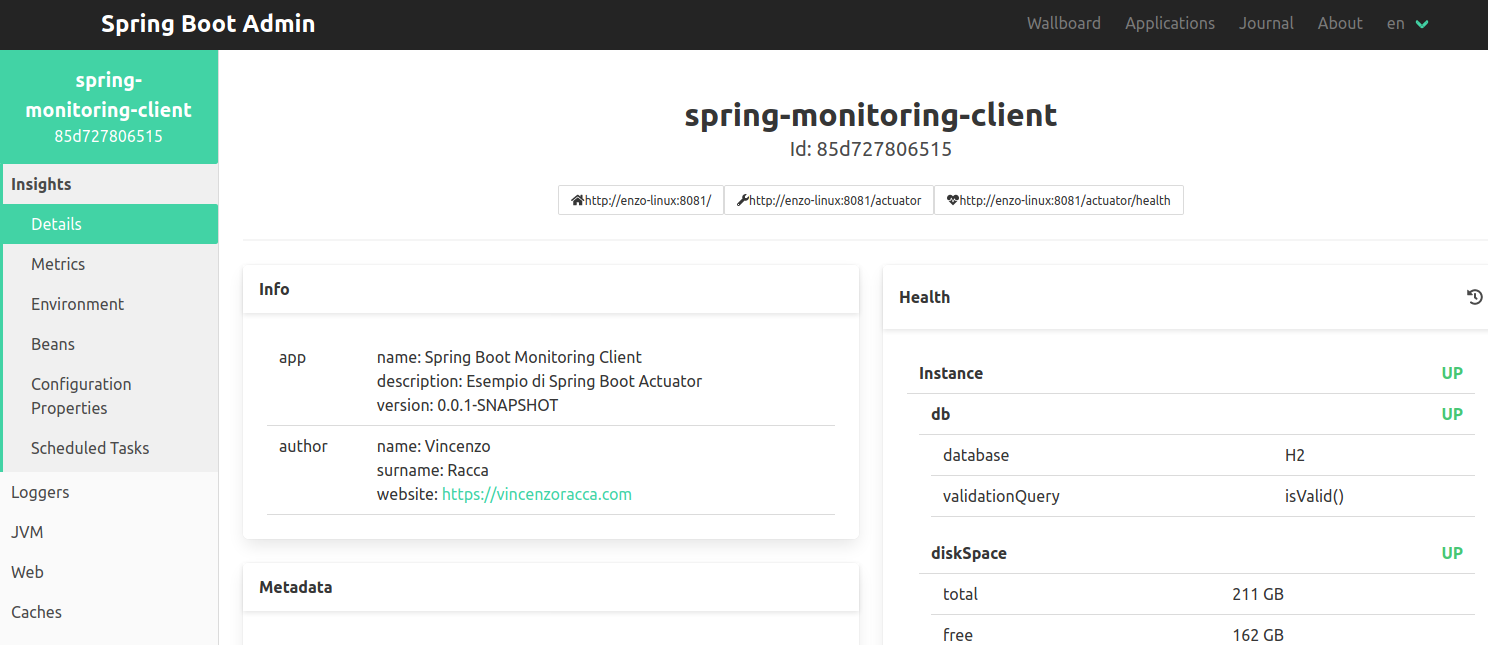
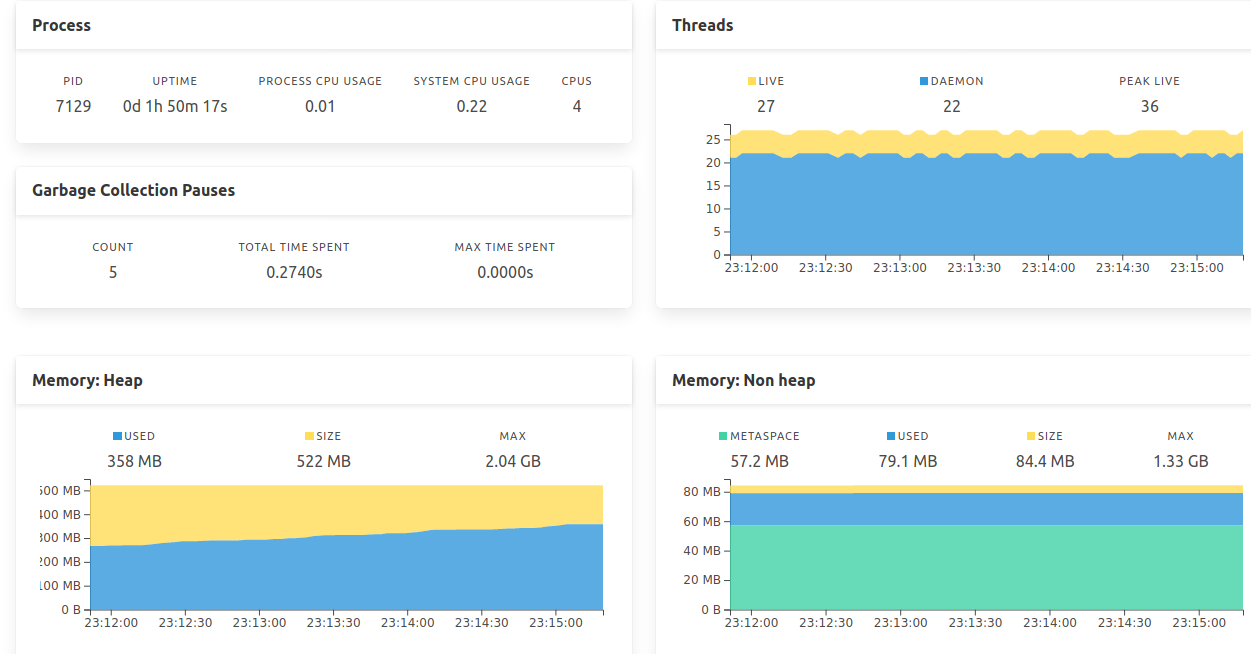
We have practically all the APIs of Spring Boot Actuator in visual format instead of JSON!
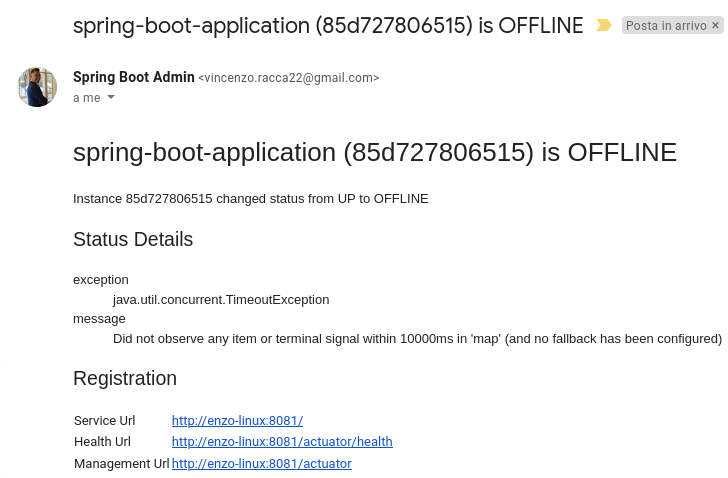
If we have also configured the email notification system, and we try to turn off the client application, we will receive an email of this type::
Conclusions
We have seen the Spring Boot Actuator module that allows us with simple steps to monitor our Spring Boot application.
We have also created a Spring Boot Admin app and associated it to the Spring Boot Actuator app, thus having the possibility to have
app monitoring information in graphical format instead of JSON.
We have seen just a small part of Spring Boot Admin; you can for example integrate the security module or add new pages to the default screen.
You can download the full project (client and server modules) from my github in this link:
Spring Boot Monitoring
Posts of Spring Framework: Spring
Spring Boot Actuator's documentation: Spring Boot Actuator
Spring Boot Admin's documentation: Spring Boot Admin
Recommended books about Spring:
- Pro Spring 5 (Spring from scratch a hero): https://amzn.to/3KvfWWO
- Pivotal Certified Professional Core Spring 5 Developer Exam: A Study Guide Using Spring Framework 5 (for Spring certification): https://amzn.to/3KxbJSC
- Pro Spring Boot 2: An Authoritative Guide to Building Microservices, Web and Enterprise Applications, and Best Practices (Spring Boot of the detail): https://amzn.to/3TrIZic